When it comes to being a data-driven marketing team, there is not as much opposition between content and data as once thought.
Two central themes that highlight this idea came out of the Opening Session of The Adobe Summit — The Digital Marketing Conference. They are:
- Use data correctly to support a story
- Ensure the story you’re telling can be relayed to a wider audience
Marketers need to quit treating their data analysts as number-crunching minions and start seeing them as contributors with a vital perspective of the greater customer story.
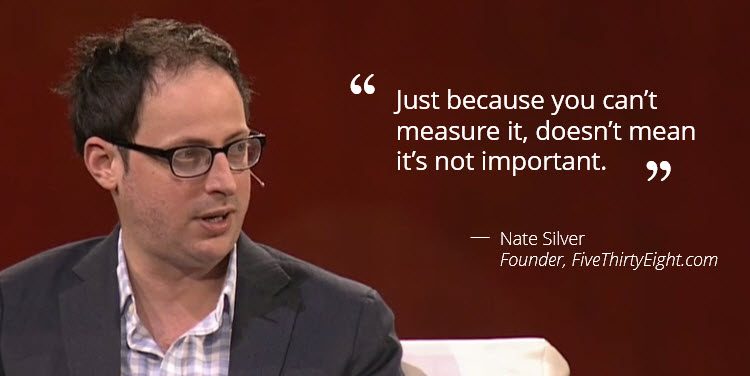
Nate Silver, Founder and Editor in Chief, FiveThirtyEight.com, spoke about how useless data can be if you can’t communicate it to a wider audience. The practice of collecting, analyzing and interpreting data can be very costly, and marketers need to maximize ROI by making sure they tell the correct story and that it can be spread across their organization.
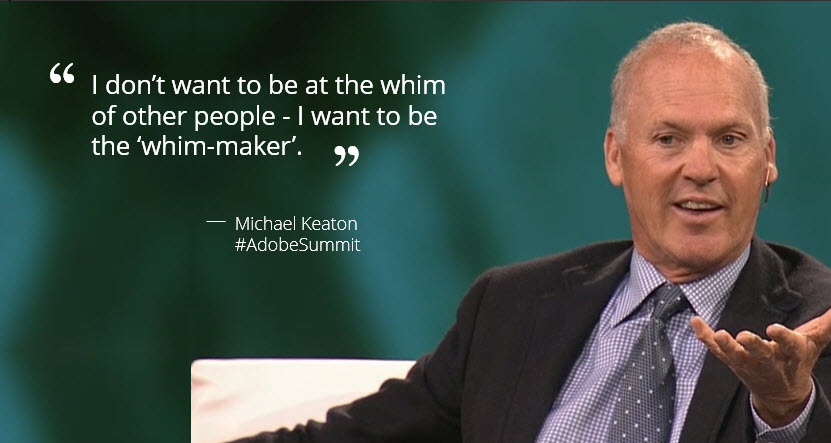
A point that Michael Keaton, an actor known for his work in “Beetlejuice” and “Birdman,” mentioned during his portion that fits this point is that we have all this technology (such as movie tech and CGI, etc.), but sometimes the best story is done with the simplest of tools. Success isn’t about the awesome technology used but about the story told with it.
Nate maintained throughout his speech that marketers need to be able to tell a story with data or it is useless. In order to use your data properly, you must know what the narrative should be. You have to be thoroughly researched in the area and understand as much as possible to be able to determine:
- What the story is, and
- Where data fits into it
I see data reporting and interpretation as an art, very similar to storytelling. However, data analysts are too often siloed. We have to understand that no one writes in a bubble, and marketing teams should understand the value and perspective data can bring to a story.
I often see a marketer who needs a piece of data to help support the story, but the analyst has no idea what the story is. So the analyst blindly gives a readout of a metric without context of where and how it will be used. These two people should work together to tell the story.
When this collaboration happens in companies, when the in-depth knowledge of the marketer combined with the creativity of the analyst, who knows the data and therefore knows which piece or combination of data will work best, the end result will be a better story.
A story can be broken down into several key parts.
Below I will tell you how to best use the data to tell the story in a manner that will resonate with your organization and even be enjoyable to digest. These can take the form of raw numbers or visualizations.
The Exposition:
The exposition gives important background information to your audience. If you will be presenting to multiple types of audiences, consider tweaking for each group so they get information relevant to them. Start by showing the history of the metric or area of your site that you are trying to speak about. You can even use comparative industry figures to accentuate the positives or negatives of these attributes.
The Rising Action:
The point of the rising action is to share a series of events (here: data points) that lead you to the discovery you are trying to convey. Use this section to highlight all the different pieces of data that led you to dive deep in order to gain insight. Every piece of data in this section should be a small piece of the whole but relevant to what you are trying to communicate.
The Climax:
This is where your story should take a turn. If you are presenting year-end results and they are positive, then this should be where you show the overall impact that the previous data point contributed to.
If you are highlighting a deficiency, or area of opportunity, then this should be where you reveal the change that needs to be made. If you complete the rising action section well, then your climax will be almost self-evident. Clearly state your goal that needs to be accomplished from this point on.
The Falling Action:
This is where two opposing forces have their final conflict, and the outcome is determined. In business, use your data to show what actions and next steps will be needed to complete the objective laid out in your climax.
You can also give multiple options and use data to compare and contrast the pros and cons of each if you are trying to spark debate. Often, the falling action and resolution (see below) will be written in real time in the board room with all parties weighing in (if it is in the present).
The Resolution:
If in the present tense, this concluding action may be an action item from a meeting or any other outcome. If this is in the past tense, then this is where you may show the impact or other conclusions that occurred. Either way your entire audience should be on the same page and in agreement on what the story meant.
If this is not the case, then this goes back to Nate Silver’s point — data is useless unless you can convey it to a broad audience. Revisit the other sections of your story to see where you lost the audience or gave conflicting points.
You may also like
Digital Marketing: Quick insights from Adobe Summit on perfecting the art and science of marketing [More from the blogs]
Metrics and Analytics: 4 questions every marketer should ask their data analysts [More from the blogs]
Marketing Analytics: 4 tips for productive conversations with your data analyst [More from the blogs]
Marketing Analytics: 6 simple steps for interpreting your data [More from the blogs]


