

Exceptional lifts do not always indicate exceptional results. You always need to look at the data with a discerning eye.
For example, we recently ran a test with one of our Research Partners that offers products and services to certain high-tech industries.
All of its business is online and 90% of its products are digital. This test was designed to be a value proposition development and thought process test on the company’s primary product page, which represents a significant amount of its traffic and revenue.

(*Please Note: We have anonymized the image here to protect the competitive advantage of our Research Partner – Ed.)
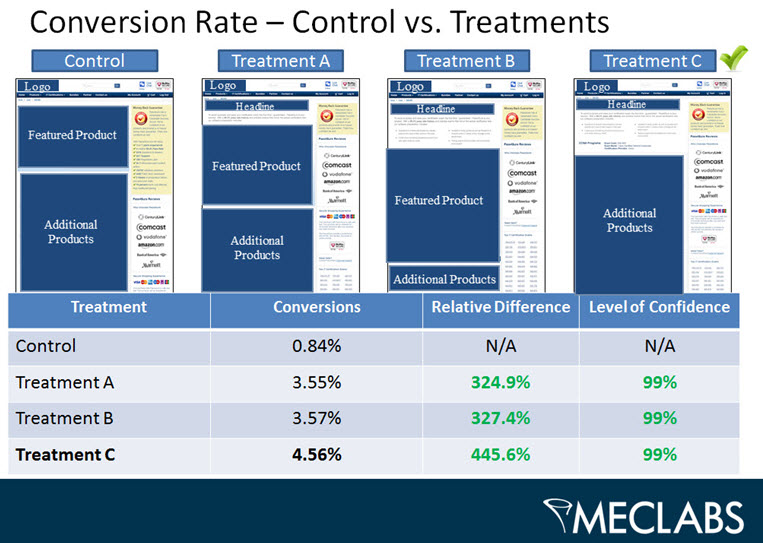
When we got the results back, we were all very excited that treatment C indicated a relative lift of 445.6%.
At this point, we could have taken the results, patted everyone on the back, and adopted the new treatment. Why not?
The results seemed reliable given the test validated at a 99% statistical level of confidence. By all accounts thus far, we had more than quadrupled our Partner’s revenue. Cha-ching!
How could things get any better?
Signs of trouble in paradise
But …
Wait a minute …
What is the standard conversion rate for the control page?
For some reason the control performed significantly below the historical conversion rate of 3.83%. In other words, the historical conversion rate represented a 356% lift over the control.
Houston, we have a problem!
What are we dealing with here?
Here are some facts about the test to help us investigate further:
1. Our test cell included only the top-selling product page for the Research Partner.
2. Our Pre-Test Estimation tool indicated we could run four treatments and have a reasonable expectation to reach validity in 13 days.

Based on our observed data we made a few discoveries:

The control had six days in a row with no conversions. The observed test overall conversion rate ended up at 3.08%.
Also, only one of the treatments outperformed the site’s historical conversion rate overall.

None of the treatments came anywhere near our Traffic Planning tool’s estimated assumption of a 15% conversion rate. Ouch! Bad assumption on our part.
So, what else could be going on here? We obviously have a problem somewhere.
- Can we trust the data? So we checked all of our tracking codes. All code snippets were placed correctly.
- We checked the back-end sales. They matched the test data.
Could there be a history effect?
Unfortunately, we were unable to discern the page’s performance from the previous years during the testing time period, but the Research Partner didn’t see any overall drop in sales during the testing period.
However, with between two to 10 conversions per day making such a huge difference in the conversion rate, it was obvious we needed to rerun the test to confirm or discredit the test data.
Not our favorite decision to make, but obviously the right thing to do with all of the facts.
When in doubt … start supplemental testing
Here are the supplemental products page test results:

As you can see above, we ran a cloned control which is designed to determine what inherent variability is present in the test cell.
What’s also interesting here is the cloned control beat out an identical page by a relative difference of 30%.
What’s going on here? What happened to our huge lift?

What we were dealing with is a problem of insufficient conversion events.
Since we planned our test with a 15% projected conversion rate for our control page and only experienced conversion rates between 0.84% and 5.62%, we need to redesign our next test.
Now here’s the answer to our testing challenge
We designed a template test, where we included the top 20 products, therefore increasing the number of conversion by a factor of 10. This should equalize our results, allowing us to make reasonable conclusions as to visitor behavior and the relative effect of the tested variables and values.
Remember to keep your eyes open as you analyze your test’s data.
If it is a significant outlier and there is no apparent reason for the significant difference, be sure to confirm your results before adopting a “winning” treatment.
In some cases, that winner could cost your company a lot of money.
Related Resources:
Landing Page Optimization: 6 common traits of a template that works
Landing Page Optimization: Simple pop-up overlay increases conversion 63%
Landing Page Optimization: Simple color change increases conversion 10%
I would wait to have at least 5 conversions per treatment (including the control). Otherwise, volatility will skew your numbers.
Sometimes it helps to test a duplicate of the control.
A versus an exact copy of A versus B.
Then continue to run the test, at least until results from the duplicate pages have normalized and start to mirror each other.