

Marketers often struggle to know what metrics to use when trying to decide on the positioning of their marketing collateral. This can lead to many problems. At MECLABS Institute, the parent company of MarketingExperiments, we have run experiments and tests for over 20 years to help answer this question.
Customers take many actions when moving through the funnel, but what is the ultimate goal the company is trying to achieve with their marketing collateral? By answering this question, companies can best determine what the most important KPI is to measure.
To best illustrate this point, let’s walk through an experiment that was run regarding metrics. By reviewing this experiment we will understand how important it is to have a clearly defined idea of what the ultimate goal is for your marketing collateral.
The Experiment:
Background: A large newspaper company offering various subscription options.
Goal: To determine the optimal regular price point after the introductory discounted offer rate.
Research Question: Which price point will generate the greatest financial return?
Test Design: A/B split test
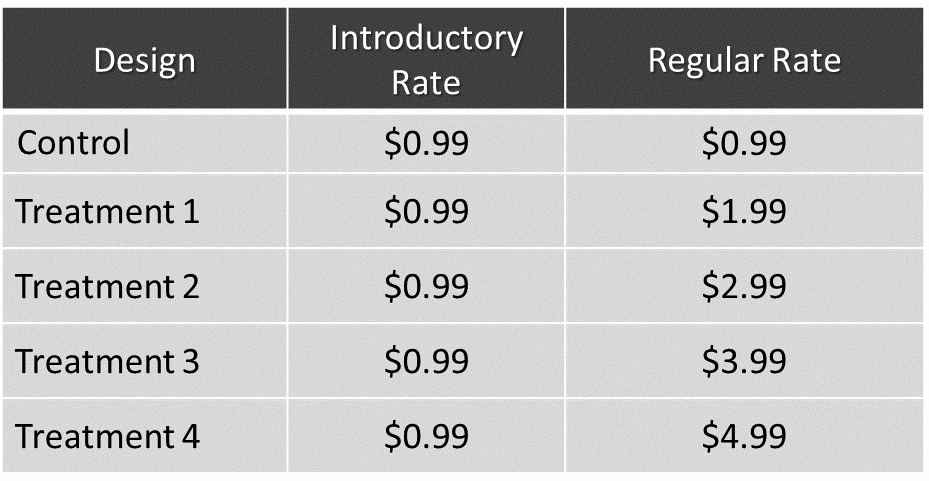
Subscription services often offer a discounted introductory rate for new subscribers. This gives potential subscribers a low-risk opportunity to try out the service for a period of time before the cost defaults to the regular full price. In this test, The Boston Globe team hoped to determine the optimal price point for a monthly subscription after the introductory offer rate expired.
Five variations were tested. The Control and all four treatments used a $.99 introductory price for the first four weeks of subscription. After the introductory price ended, customers incurred the regular weekly rate, which escalated per treatment.

Not surprisingly, the Control, which had the same $.99 regular weekly rate as the introductory offer, outperformed all four treatments. In fact, with each increase in regular weekly rate, response decreased.

At this point, it is easy to see how a $.99 regular rate would beat out the more expensive treatments and therefore lead to more subscribers.
But was getting more subscribers the ultimate goal the company had? We must keep in mind the goal of the experiment, which was to find the optimal price point after the introductory offer.
In order to continue our search for the optimal price point, the next step in the experiment was to look at which price point had the lowest cancellation rates after the introductory period. When we looked at the data, we discovered a direct correlation between regular weekly price and cancellation rate. Simply put, the lower the weekly price, the lower the cancellation rate, and vice versa.

With this knowledge of the cancellation rates, it still looks like the $.99 price point is the best offer for the company. But have we found the most important KPI to measure when it comes to finding the optimal price point for The Boston Globe?
You may want to recall here that the research question was, “Which price point will generate the greatest financial return?”
At this point in the experiment, we still haven’t answered that question yet.
The next step was to look at the total revenue per subscriber. This is where we started to think differently about metrics to understand conversion for The Boston Globe.

While the $.99 weekly price point generated the highest subscription rate and the lowest cancellation rate, it also had the lowest revenue per subscriber during the testing period. It was Treatment 4 that generated the highest revenue per subscriber.
Knowing what we know about conversion at MECLABS, we know that you must look at all metrics before coming to a final conclusion. This entails looking at the test from different angles. It is simply not enough to look at the subscription and cancellation rates, and it is also not enough to only look at the total revenue per subscriber.
We had to take the test one step further, and look at the total revenue from the test traffic. Interestingly, we found that Treatment 3 had produced the highest total revenue from the test traffic.

Even though Treatment 4 had the highest initial revenue per subscriber, Treatment 3 had a 163% relative increase in total revenue over Treatment 4.
What is interesting here is that some companies would have stopped when they saw that the $.99 regular weekly rate had gained the most total subscribers, or even when they saw that the $4.99 price point generated the highest revenue per subscriber. We as marketers have to be aware of what is actually going on. If The Boston Globe’s ultimate desired action was for individuals to subscribe, then they would have gone with the $.99 regular rate.
Instead, The Boston Globe’s ultimate goal was to find the price point that generated the greatest financial return. From our testing, we can see that the greatest revenue is being produced in Treatment 3, at the $3.99 price point.
Key Takeaway
At this point we can see why it is so important to know exactly what metrics to use when your company has established a goal. You must know what the most important KPIs are to measure when looking at the data from your experiment. It is vital to look at all the different elements of a funnel to see how all of the different actions tie together to create an overarching desired action which leads to the goal of the company.
The Boston Globe could have easily looked at the number of subscribers it received from the $.99 weekly price point, and chosen this as its regular rate; however, the company would have left revenue on the table had it not considered all metrics from this test.
You might also like
MarketingSherpa Summit 2016 — At the Bellagio in Las Vegas, February 22-24
Site Optimization: 2 strategies to consider when trying to increase conversion