

Some tests and their results provide the opportunity to open up bigger discussions.
They are true diamonds in the rough that reveal some interesting insights about not only customers, but also us. I don’t know about you, but sometimes a small look inward can have a big impact out the look outward.
In today’s MarketingExperiments blog post, I wanted to share with you an interesting experiment from a recent Web clinic that increased lead rate 331% by optimizing the company’s value exchange experience with prospects.
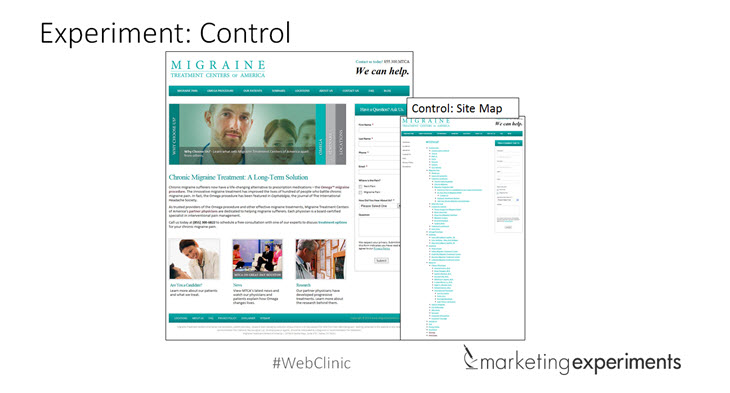
Background: Migraine Treatment Centers of America offers an innovative long-term migraine treatment solution to people suffering from migraines.
Goal: To increase leads from the microsite.
Primary Research Question: Which value exchange strategy will result in a higher conversion rate?
Test Design: A/B multifactor split

The MECLABS Institute research team hypothesized that one of the biggest problems with the control was it did not effectively connect momentum created by the content to the next logical step in the conversion process.
Simply put, the site had content and it had calls-to-action, but the problem was a substantial break in continuity between them.

Some of the changes in the Treatments focused on two key things:
- A redesign that organized content based on action-oriented engagement.
- The main call-to-action was placed below the content to direct users’ momentum from the content into a clear course of action.

As you can see from the results, the Treatment outperformed the Control by a staggering 330.60% relative difference in lead rate.
What you need to know: Influence with no direction drives no action.
Remember that opportunity for discussion I mentioned earlier?
Here we are.
I love this test because it illustrates a dirty little secret in marketing that far too often pinpoints content as a convenient scapegoat for underperformance. It makes sense, given it’s easier to change a few lines of copy considered culprit and keep hoping for the best.
But that is a misguided strategy which misses the whole point of marketing to begin with. Your marketing exists to influence and guide customers throughout a buyer’s journey. All the copy changes in the world, when devoid of testing the journey itself, won’t fix the yellow brick road.
I’d love to hear your thoughts on this as well in the comments below.
Also, if you’re interested in learning more about how testing and optimization can aid your lead generation efforts, feel free to check out this recent Web clinic “Increasing User Engagement.”
You might also like
Online Testing: Why are you really testing? [More from the blogs]
Testing and Optimization: How to get that “ultimate lift” [More from the blogs]
Lead Generation: Is your registration form part of the customer journey? [More from the blogs]
If the lead rate was originally 1.167% and the treatment had 7.0%, what formula did you use for calculating the relative change at 330.6%? (I believe it is actually an increase of 500%: treatment conversion rate / control conversion rate minus 100%).
Also, the table refers to it as a “read rate,” but I think that may be a typo.
Hey Brian,
Great catch! There were two typos in the chart. The label in the chart should read “lead rate” not “read rate.” Also, the original lead rate was 1.67%, not 1.167% as written. Using the 1.67% figure, the relative change of 331% checks out. Sorry for the confusion, but thanks for keeping us honest!
Please let me know if you have any other questions. Thanks!
Kayla
I always tell my clients that they need to get people to the right information quickly. You never know what type of traffic lands on the page, especially homepage, so getting them to the information relevant to them quickly increases the likelihood of them converting. I like to use receptionist analogy when I explain it to my clients. When you show up at the office building and don’t know where to go, a receptionist can quickly tell you exactly where to go. Same for homepage or category pages, make it your virtual receptionist to get visitors to the information they’re seeking.
Thanks for sharing this research study John.
That’s a great analogy, Viktor. Completely agree. When a motivated prospect comes to your page, every second that they spend trying to find the right information is another opportunity for them to bounce from the page. Aligning the page with customer motivation is key to maximizing conversion.