

Abstract: MarketingExperiments is a publishing branch of the MECLABS Institute, a research laboratory dedicated to discovering what really works in online marketing. MECLABS gains this knowledge by utilizing the scientific method to create real-world experiments and then extracting successful principles based on the data generated by this experimentation.
To ensure a consistently high level of scientific rigor in this experimentation, MECLABS’ research analysts utilize a uniform test protocol and series of heuristics to help analyze real-world data and create new single and multi-factor tests that can reveal further discoveries.
MarketingExperiments is a publishing branch of MECLABS Institute, a research laboratory with a simple (but not easy) seven-word mission statement: To discover what really works in optimization. We focus all of our experimentation on optimizing marketing communications. We test every conceivable approach and publish what we learn (at no charge) on this site.
OF THE MARKETINGEXPERIMENTS METHODOLOGY
 Our research is conducted according to the principles and practices of experimental science. Experiments are designed and conducted in accordance with a larger research plan using a formal test protocol, developed by MarketingExperiments exclusively for its research. Research questions are formed and evaluated as hypotheses, which are tested and the outcomes are statistically validated.
Our research methodology allows us to make the most of any of the widely implemented testing and analytics solutions currently in use (such as Google Website Optimizer, Omniture Test&Target, Google Analytics, Omniture SiteCatalyst, ExactTarget, Eloqua), whether independently or integrated within our own testing platform (the MarketingExperiments Lab™). Using these testing and analytics solutions, we conduct single-factorial (A/B), multi-factorial (multi-variable/MV) and sequential (if unavoidable) tests.
Experimental subjects are most typically pulled from a continuous, real-valued random sample population of consumers, and occasional focus group testing is performed, especially in new product development situations. The full spectrum of marketing communications is tested, from web pages, email messages, banner and text ads to traditional channels like TV, radio, and print media that drive traffic to an online platform (such as the desktop or Mobile Web).
 MarketingExperiments empirical research focuses on real-world Internet marketing challenges and opportunities. By conducting experiments with actual commercial offerings, we uncover relevant, practical insights that enable our Research Partners to discover what works – for their products, with their target customers, in today’s ever-changing marketplace.
The expertise of MarketingExperiments’ scientists and analysts is informed by the hundreds of experiments they conduct and participate in each year. Their experiments are informed by these insights, combined with the discipline and wisdom that come from both their formal training in the science of Cognitive Response Optimization and the experience of their prior research.
As technology and culture evolve, MarketingExperiments continues to stay on top of what works best by selecting and collaborating with a small set of organizations capable of responding to and benefiting from increased demand for their products – those with the infrastructure and executional capabilities (e.g., inventory or fulfillment system) that can handle a significant increase in demand.
The findings from these real-world experiments are added to the MarketingExperiments research repository – which we believe to be the most extensive body of experimental research data related to digital marketing and made available at no charge to professional marketers through our Research Briefs.
 MarketingExperiments is a laboratory that uses empirical, relevant data to craft and teach Internet marketing principles. By conducting experiments instead of just relying on so-called “marketer’s intuition,” we are able to discover what really works today. MarketingExperiments’ approach transcends “best practices” by discovering and applying principles that help determine when each widely accepted “best practice” works (and when it does not).
The goal of these studies is to discover the most effective way to get prospects to take the desired action, whether it’s purchasing a product, starting a subscription, completing a lead form, making a donation, or initiating some other action. We translate the insights garnered from helping actual companies reach tangible objectives into teachable principles that can benefit our worldwide community of almost 100,000 marketers.
Through more than 15 years of extensive experimentation and study, MarketingExperiments research analysts, led by Dr. Flint McGlaughlin, have replaced literally hundreds of special case practices with a unified set of core principles defining and describing the Offer/Response-Optimization process.
These principles are so well defined that they have been taught to hundreds of professional marketers through the MarketingExperiments Training and Certification Program.
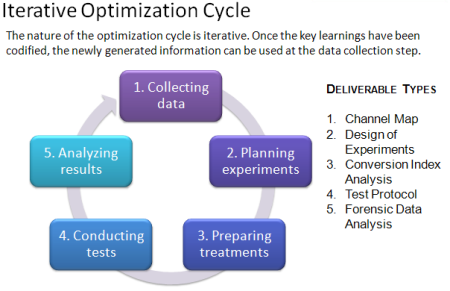
Experimental science consists of a repeated process of observational inquiry, hypothesis formation, testing, analysis and interpretation. MarketingExperiments has developed and applies a decidedly practical form of this discipline which is centered on an empirically derived model of human behavior, motivation, and decision making consisting of a small set of core principles, or “heuristics.” This model provides proven principles for the planning, design, conduct and interpretation of conversion optimization tests, thereby greatly reducing the time-to-discovery – and to increased demand.
Several key elements of the MarketingExperiments methodology are formulated using a heuristic approach. That is, tools to help organize one’s thinking and analysis of a given product offering, marketing message, or experimental design.
For instance, our Conversion Index analysis is based on the well-known Conversion Sequence heuristic. This empirically derived framework brings structure and clarity to analysis of the conversion process and directs the focus and prioritization for optimization energy. The Conversion Sequence is expressed as follows:
C = 4m + 3v + 2(i-f) – 2a ©
Wherein:
C = Probability of conversion
m = Motivation of user (when)
v = Clarity of the value proposition (why)
i = Incentive to take action
f = Friction elements of process
a = Anxiety about entering information
Please note: For the purposes of the MarketingExperiments testing methodology, Friction is defined as a psychological resistance to a given element in the sales or sign-up process. Anxiety is a psychological concern stimulated by a given element in the sales or sign-up process.
Another popular heuristic is the Email Messaging Optimization Index:
eme = rv(of + i) – (f + a) ©
Wherein:
eme = email messaging effectiveness index
rv = relevance to the consumer
of = offer value (why)
i = incentive to take action
f = friction elements of process
a = anxiety about entering information
These are only two of the heuristics we deploy on behalf of our clients. They are only examples of the codified approach we have developed to facilitate a consistent, repeatable approach to testing. The application of the above heuristics, as well as the others quantified in the MarketingExperiments research process, allows us to empirically extend these findings to any number of business partners.
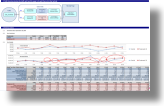
 MarketingExperiments testing methodology relies extensively on data analysis in three key areas: understanding target customers, identifying optimization opportunities, and assessing test outcomes.
Creating the optimal message and process for the target customer is the essence of optimization. MarketingExperiments meticulously studies all available historical data, from web analytics to transactional and demographic records, to understand existing customer segments. Through thousands of projects, we have discovered that identifying these segments early allows us to appeal to each in the most effective way, resulting in greater improvements than those afforded by optimizing in aggregate. In multi-product scenarios, segmentation analyses have helped us determine the right offer, the right up-sell and cross-sells, and the right prices for each segment.
Today’s Web marketer is faced with a perpetual parade of competing metrics software and testing tools – each with its own strengths and limitations, owing to its particular approach and nomenclature. MarketingExperiments’ approach to Web-marketing optimization is science-centric, and consequently can be robustly applied using any commercial-grade web metrics or testing solution – even across different systems.
While all of the current commercial grade testing and metrics systems help you with how to test, the greatest obstacle to breakthrough optimization gains is establishing what to test. The result is, marketers get seemingly significant results, masking the fact that testing a different page, or a different step in a process, would have produced something far more meaningful and profitable.
3. Single-factorial and multi-factorial testing
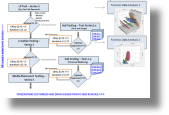
After analyzing the Internet marketing challenge using applicable heuristics and analyzing historical data using various established statistical tools and predictive algorithms, MarketingExperiments research analysts develop a hypothesis (or multiple hypotheses) and design real-world experiments to test them. According to the testing objectives, as well as the available tools and traffic, experiments are designed to maximize the value of each test to achieve the greatest long-term value in the shortest period of time. Typically, that includes a mix of single-factor (a.k.a., A/B) and multi-factor (a.k.a., multivariable or MV) tests.
 The Test Protocol is a software-based tool developed by MarketingExperiments to guide and facilitate the experimental testing process. It is the document of record for each test, and the repository of Test Protocols is an essential component of the MarketingExperiments knowledge base.
The design of the Test Protocol is continually refined through ongoing experimentation. The composition, structure, and sequence of the Test Protocol are designed to guide the process and enforce the standards and discipline of scientific experimentation aimed at hypothesis testing.
Depending on the key metric, a statistical test planning tool is then used to estimate the projected sample size required and to project test duration.
As the test data is gathered, it is accumulated in the test protocol and the computations refreshed periodically to test for validity. Depending upon the experiment design, a single test sequence may involve an iterative approach to identifying and pruning out under-performing treatments while adaptively introducing new variations as informed by the prior recursions. This approach can be used to accelerate the pace of discovery with minimal risk of missing an optimal solution.
Once the optimal experimental treatment is identified – or the design sample size is exceeded and the test is deemed inconclusive (i.e., based on the data received, a winner cannot be chosen in an acceptable time frame) – the complete data set is analyzed in the context of the original set of hypotheses to evaluate whether they are supported by the experimental data or whether they must be rejected. While being right is usually gratifying, we often learn more from the tests that prove us wrong than those that suggest that we had it right – for therein lie the seeds of new discovery.
The last step of every test sequence is interpretation and recommendations for further research. Since the test hypotheses, and the treatment designs, are informed by the then-current body of MarketingExperiments optimization principles, this step ensures that MarketingExperiments continually stays on top of changes in “what really works” as markets, tools and cultures emerge and evolve; and the principles thereby remain “evergreen.”