


To stay ahead of the curve with optimization, marketers need to know what’s working now — and glean strategies that they can quickly apply to their own pages and websites.
In our April 8, 2009 clinic, we took an in-depth look at three new tests featuring some of the most recent results from our work with research partners.
These tests demonstrate optimization strategies you can apply to your landing pages right away, and break down concepts that pave the way for future improvements.
In addition to the print–friendly research brief below, you can:
Part I
Examining the role of friction in lead generation
In difficult economic times, when prospects are wary of committing to any but their most advantageous offer, our most successful tests resulted from strategic application of friction, one of the key elements in the MarketingExperiments Conversion Sequence.
Within the Conversion Sequence, friction is defined as psychological resistance to a given element in the sales process. Prospects experience friction in numerous ways, including perceiving forms or step sequences as too arduous and complex or simply not wanting to read large blocks of text. For the most part, marketers perceive friction as negative page elements that should, if possible, be minimized.
Friction, however, can play a negative or a positive role in the conversion process, depending on how it is applied.
This brief will clarify how friction can be relieved, or employed, in the lead generation process.
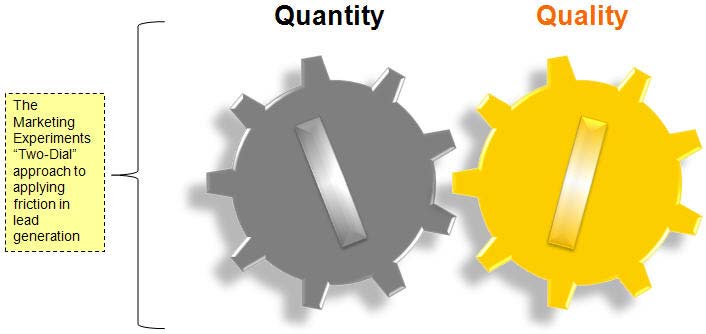
This approach can apply to lead generation in both B2B and B2C offers. An offer that has a long sales cycle or education process, requiring extended communication between marketers and interested parties, can benefit from the strategic application of friction as exemplified by the two-dial approach. If the net effect of adding friction provides all involved with better information on how to proceed, the added friction is effective.
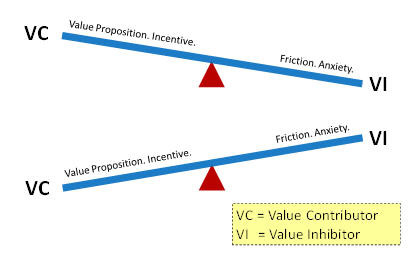
Each dial represents an approach to the role friction plays in lead generation.
- Decreasing, or dialing down friction, results in increased lead quantity.
- Increasing, or dialing up friction, creates increased lead quality.
Lead generation strategies typically focus on increasing lead volume. One of our recent tests examined whether it was possible to optimize to increase both the quantity and quality of leads.
Case Study 1
Background:
This B2B partner is a provider of integrated industrial intelligence products and professional services for industrial businesses.
The goal:
The company sought to increase their number of qualified leads.
The approach:
Adapt the lead generation process to gather more information.
Test structure:
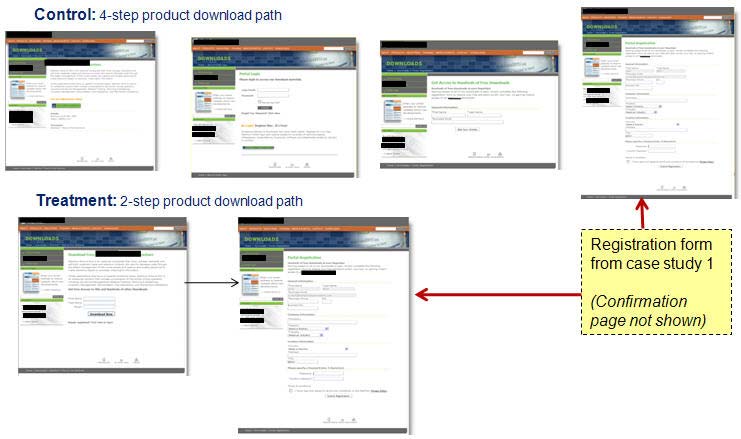
The first test took a focused approach to refining only their registration process. In an A/B split test where traffic was divided evenly between the control and the treatment, the treatment extended a one-step process into a two-step process.
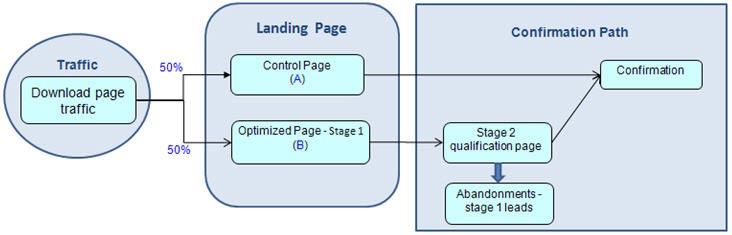
The objective behind this strategy was to increase friction by separating the one-step lead generation page into multiple steps, filtering leads according to motivation level. In other words, friction was increased, or dialed-up according to the two-dial approach, on the hypothesis that prospects who were early in the sales process or simply doing preliminary explorations would abandon a longer process after realizing there was more than one page, and more detailed information, involved. More determined and sales-ready prospects would persevere through the second page. While the company might experience a decrease in lead quantity, the remaining leads would be of a higher quality, more sales-ready and more likely to convert.
Lead generation:
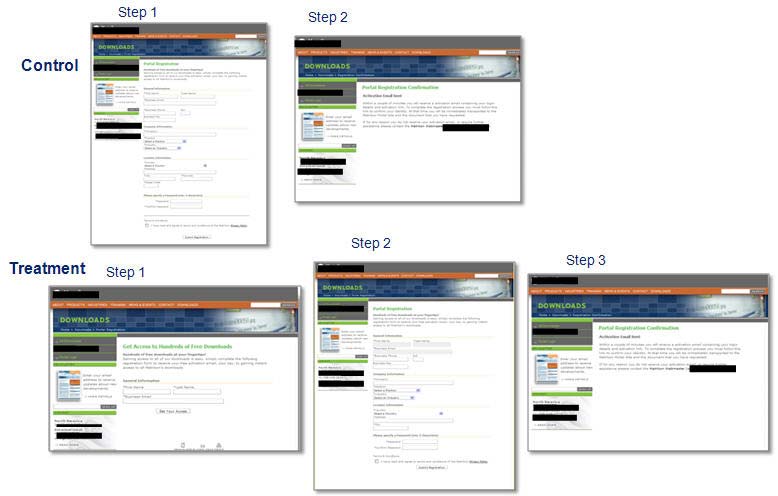
The first page of the treatment has a very streamlined email capture form while the second page asked for more detailed information. The confirmation page was the same for both control and treatment.
In the treatment, leads that went through the first registration step were identified as Stage 1 leads. Leads completing both steps were identified as Stage 2 leads. In this way when the leads were passed on to the sales staff, they knew which leads to focus on first.
Results:
| Stage 2 Lead Generation Rate | Conv. Rate |
|---|---|
| Control | 47.27% |
| Treatment | 46.27% |
| Relative Difference-0.02% | |
What you need to understand: In primary analysis, the test appeared inconclusive. However, splitting the registration page into two pages did not decrease the number of qualified leads and created a new source of Stage 1 leads for development.
Analysis:
Previously, the company did not have a simple email capture mechanism in place. If prospects failed to complete the registration form, the company had no way to remarket to them. In addition, our analysts noted that a long form registration process appeared to be the industry standard. Breaking the registration form into two steps might truly give this partner a competitive edge in lead nurturing.
Applying friction to lead generation
This table visually represents how low and high friction can be applied to segment the lead generation process into phases.

If youre trying to generate a high volume of leads, consider implementing only a low friction email capture. On the other hand, if you seek improved lead quality, even if you have many required fields when gathering information, present a simplified version to prospects early in the process.
Organize your form fields in clusters of related information, grouping information that prospects would consider connected, such as address information or company details. If information appears logically connected or sequential, then the length of a form seems less cumbersome.
Further results:
Bifurcating the form did not significantly increase or decrease the number of Stage 2 leads. Motivated prospects are not put off by a one-page long form or a two-page process. However, the treatments two-step process has a distinct advantage over the controls one-step process in that it generates a new source of leads for the company, Stage 1 leads for future nurturing.
| Total Lead Generation Rate | Leads |
|---|---|
| Control (Stage 1 leads) | 0 |
| (Stage 2 leads = total leads) | 157 |
| Treatment (Stage 1 leads) | 77 |
| (Stage 2 leads) | 155 |
| (Total leads) | 232 |
| Relative Difference47.7% | |
What you need to understand: In total lead generation, the treatment outperformed the control by 47.7%. By slightly increasing friction, the company was able to increase lead quantity and maintain lead quality.
The next phase of work with the partner focused on testing how this improved lead generation practice would fit within the companys offer structure.
Case Study 2
Test Structure:
After reviewing the registration path in context of a larger process, the goal of testing changed. For prospects to avail themselves of the newly optimized registration form, it was essential to reduce friction in the download request process.
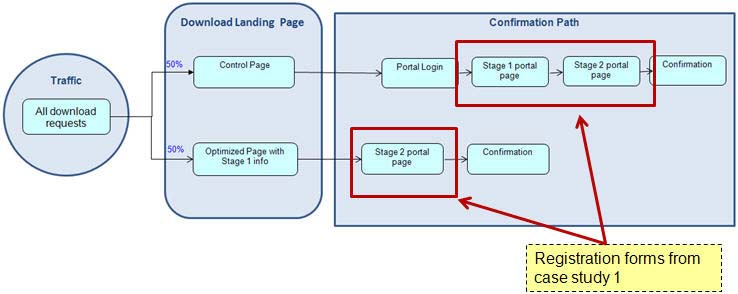
The top half of this diagram demonstrates how the original registration process fit into the context of the complete download request process. The bottom half represents the streamlined treatment.
Control vs. treatment:
Again, our competitive analysis pointed to a long download path as an industry standard. Shortening the path might be an effective way for this site to differentiate from competitors.
Control:
The first two steps of the process served as product introduction and login for return visitors.

Analysis:
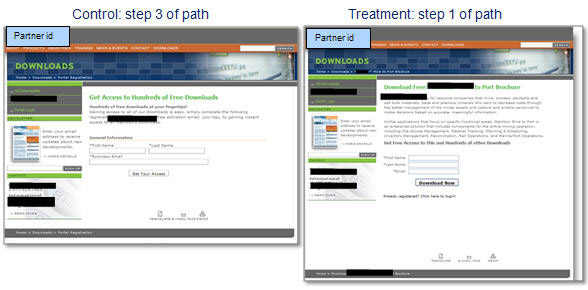
The original change in call to action from page 1 to page 2 was confusing download, moves to login and then to register. Also, new visitors must read through the whole login page for return visitors in order to find a slender registration call to action button.
Control vs. treatment:
To shorten the form, the optimized treatment moved the registration page from the third step of the control to the first step of the treatment path.
Analysis of treatment:
In this way, the first page acknowledges returning users by providing a link but also cuts out the login page as a step new visitors must go through.
In addition, the treatment:
- Moved the email capture to the first step in the download process
- Removed the general information heading
- Created greater continuity between headline and button copy
Results:
Results showed prospects responded much better to the shortened download path.
| Path Conversion Rate | Conv. Rate |
|---|---|
| Control | 2.13% |
| Treatment | 9.89% |
| Relative Difference364% | |
What you need to understand: The treatment outperformed the control by 364%. Reducing the number of steps eased friction, emphasized the benefits of the offer, and resulted in significantly higher conversions.
Reviewing the registration process of the site in isolation and then in context of the whole order path allowed for strategic application of friction that made it easier to reach and serve qualified customers.
Key Point: While friction always serves as an inhibitor to conversion, it is not always destructive.
For the second half of the web clinic, we considered friction in the context of ecommerce.
Part II
The balanced approach: ecommerce
Friction works differently in lead generation than it does in ecommerce sales. The two-dial approach may not be appropriate for ecommerce as prospects seeking an immediate purchase will avoid increased friction on a site by simply looking elsewhere.
For ecommerce, constructive friction means achieving a delicate balance between giving enough information to clarify the value proposition, yet not overwhelming prospects. On ecommerce sites, information must be provided in a quickly accessible format that matches the prospects thought process.
The fulcrum concept, mentioned in our January 7th clinic, Optimizing Offer Pages, emphasizes the importance of reducing friction within ecommerce offers. Instead of deliberately increasing friction at any time, ecommerce marketers must consider whether the content of their sites emphasizes the value proposition of the site or the offer. If it does not, it may tip the balance away from conversion.
Case Study 3
Background:
This ecommerce partner sells exterior window treatments and hardware.
The goal:
The company wanted to increase conversion.
The approach:
Test a redesigned order path against the control.
Test structure:
This was a sequential test, with 100% of the traffic going first to the control and later to the treatment. Each test ran for approximately 30 days.

Sequential testing is often the easiest form of testing to implement. In addition, if radical redesign changes many page elements, sequential testing determines whether or not the redesign is appealing to prospects. If the redesigned treatment outperforms the control, A/B split testing can be used to fine tune the most effective arrangement of page elements on the top-performing page.
However, one drawback to sequential testing is the validity threat posed by seasonal traffic. Products like shutters are highly seasonal itemsso the partner took care to run these tests in two months where records from the previous year showed no seasonal spike.
Buying shutters may be a process many property owners undergo but it is not a process they complete often. Because of the infrequency of the purchase, this site must do a good deal of prospect education. Therefore, each page presents extensive information about shutter style, price, quality and installation.
Control order path:
The control order path implied a three-step process; however, the copy and design of each page did not enforce such organization.
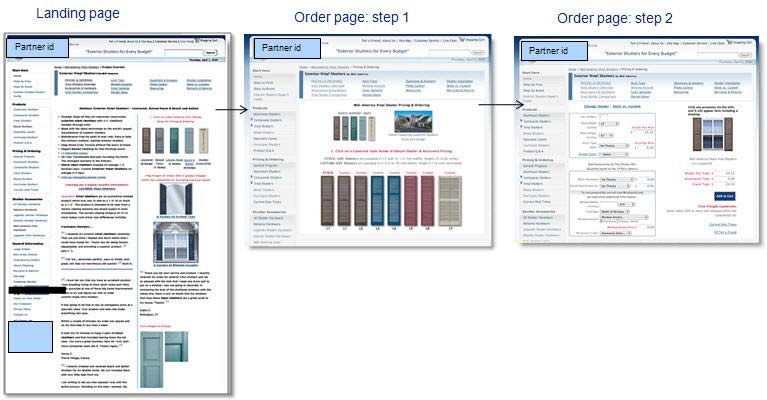
For example, the copy at the top of page three (what should be the final step in the process) read Change your shutters, effectively instructing prospects to have second thoughts.
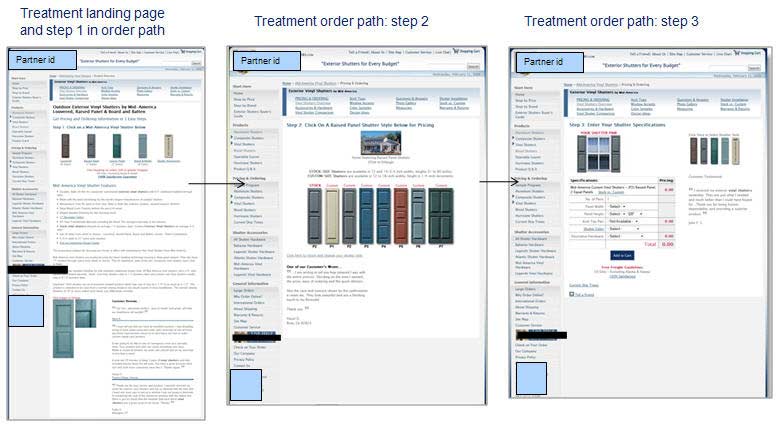
Treatment order path:
On the other hand, the headline for each page (and step) of the treatment was labeled step 1, step 2, and step 3, clearly indentifying where prospects are in the order process.
A closer view of control and treatment reveals more details of the testing.
Control vs. treatment:
Analysis:
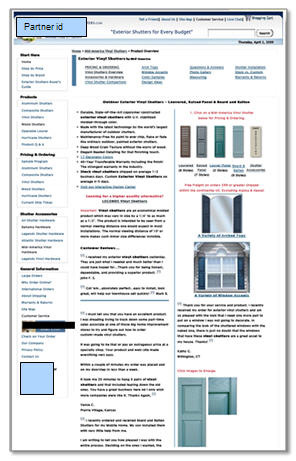
- Landing page offers a great deal of information
- Equally weighted columns
- Page layout did not follow prospect thought process
- Purpose of bulleted list unclear
- Link format inconsistent
- Redundant access to shopping options
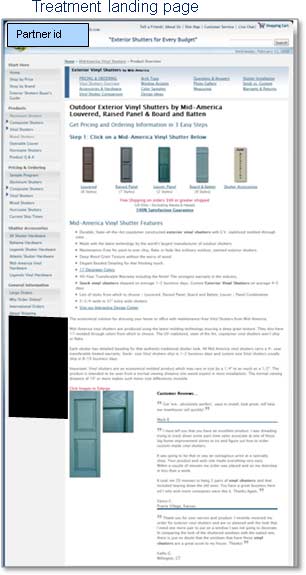
Analysis:
- Headlines and subheadlines reinforce purpose of page
- Two-column layout becomes one column
- Bulleted list has new placement and clarifying headline
- Image and customer reviews now support prospect thought process
Optimizing pages or thought processes?
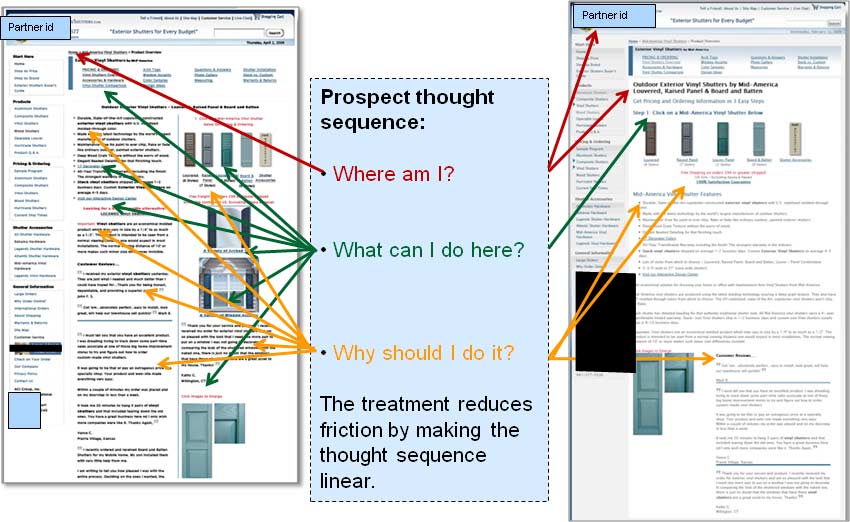
The three questions asked in the center box mirror a prospects thought sequence when he or she comes to a new landing page. Each arrow points to copy or an image where the page designers try to provide an answer to each question.
The control under emphasized “where,” leaving prospects uncertain of their location. In addition, the control overemphasized “what,” giving prospects too many choices, increasing friction and possibly causing leakage and abandonment. Testimonials and other elements that should support the value proposition and the “why” were scattered throughout the page, creating the overall impression of dense, time consuming copy.
The image on the right demonstrates the streamlining of the thought process that occurs in the treatment.
The control is full of information that could potentially be helpful to shutter purchasers. But, the treatment has retained all the information of the control while reorganizing it to match the thought sequence of visitors and support the offer and benefits of this site.
Control vs. treatment, side-by-side:
The first step in the control selection process used the first image on the page and a link to suggest prospects should choose another option. This is confusing, especially to prospects who may not yet have chosen their first option.

In the treatment, the first step is pricing for the prospects first choice. The text link below the images gives the option to choose another style but leaves out the confusing images.
Results:
| Product Path Order Numbers | Conv. Rate |
|---|---|
| Control | 1.95% |
| Treatment | 2.88% |
| Relative Difference47.24% | |
What you need to understand:The treatment outperformed the control by 47.24%.
Optimization created greater fluidity on the page: the flow of information became more natural to the prospects thought process and therefore easier to absorb. When prospects were better able to understand the offer, conversion increased.
Key Takeaways
Where/how to reduce friction:
- Simplify and shorten a process wherever possible
- Take the steps necessary to make a process clear and intuitive
- Make product descriptions easy to understand
- Make the site easy to navigate and make sorting the products easy
Where/how to increase friction:
- Identify where you have a single step process with no opportunity for capture
- Break the process into several steps, focusing on a gradual increase in friction to isolate more motivated prospects
- Be wary of over-incentivizing as that will eliminate constructive friction
As you evaluate how to or whether to apply friction to your pages, consider that the friction aspect of the Conversion Sequence has different applications depending on whether an offer is ecommerce, B2C, or B2B.
Transferable Principles:
- Review pages and processes individually and in context with various channels.
- Ensure that any friction in your processes is deliberate, not incidental.
- Evaluate friction for lead generation by determining if it improves the probability that both parties will achieve their goals (prospects needs satisfied, marketers sales ready leads).
- Measure the value of copy on ecommerce pages by evaluating where you are providing redundant — or clarifying — purchase decision information.
- Structure pages so that they mirror the thought processes of your prospect.
Optimizing landing pages can be overwhelming: there are many elements to change and it can be difficult to know where to begin. One way to begin evaluating your pages is by reviewing friction and your prospects probable thought process. Focusing on these two concepts will often spotlight areas for improvement and help you refine your paths and offers.
Related MarketingExperiments Reports:
- Marketing Blueprint 2009
- Optimizing Offer Pages
- Lessons Learned
- Value Proposition
- Clarity Trumps Persuasion
- A Proven Playbook for Growing Your Leads
- Simple Tests, Significant Gains
- Optimizing eCommerce Pages
Credits:
Managing Editor — Hunter Boyle
Writer(s) — Anna Jacobson
Contributor(s) — Hunter Boyle
Jimmy Ellis
Boris Grinkot
Bob Kemper
Andy Mott
Aaron Rosenthal
Gina Townsend
Corey Trent
Production — Austin McCraw begin_of_the_skype_highlighting end_of_the_skype_highlighting
Cliff Rainer
Amanda Mehlhoff
Testing Protocol(s) — TP 1148
TP 1170
TP 1164